

Welcome to The Graphical, wherein I run through some of the stats, figures, and maps that tell the story of Nashville SC’s recent match. Since there was an international break tossed in there, this one’s a little less immediate than usual, but I’ll start with a big-picture item to bring the narrative back around.
xGamestate
Nashville SC has begun the year as one of the top xG attacks (fourth, per American Soccer Analysis), as well as one of the best xG-against defenses (ASA has Nashville second)_. That’s a pretty good place to be statistically – it’s generally going to mean you’re putting an outstanding product on the field – but NSC’s results haven’t necessarily matched up with that impressive profile.
So what gives? One of the prevailing storylines has been that Nashville has been trailing a lot, and for obvious reasons, teams trailing in games rack up more xG than the opposition: the trailing team has to fire a bunch of shots to try to mount a comeback, whereas a team in the lead doesn’t feel a whole lot of urgency to do the same. So, let’s take a look at xG differential by gamestate*:

As you can see, the “racking up xG because they’re trailing a lot” argument gets its first hole poked: the majority of NSC’s xG differential is actually accounted for when the game is tied, and the team is more productive with a one-goal lead than trailing by one or two goals. Nashville has been productive at every gamestate except leading by two.
Once again, though, we don’t have the full picture. Those xG numbers were racked up in different amounts of time. The gamestate has been even for about half of playing minutes this season. NSC has trailed by a goal 23.4% of the time and a pair of goals 7.8% of the time. Nashville has led by a goal for 16.6% of the time and two goals 2.5% of the time. Nashville’s best per-minute xG differential comes when leading by a goal, followed by a two-goals-down state, trailing by one, and then an even gamestate.
Boiled down, Nashville is not at its best when the game is tied. But a big xGD this year is not simply a gamestate-oriented status, because the team is also not at its best when trailing, anyway.
One other oddity: Nashville is finding its best shots not when nursing a big lead (and therefore able to be selective), but rather when trailing by a pair – when you’d expect they’re launching anything and everything to claw back, hoping that a low-xG opportunity finds a bit of magic. Some of that is a statistical quirk of the Opta xG formula, which includes an arbitrary “big chance” flag that amps up the value of a shot. Some of it might be gameplan stuff for the staff to consider. Here’s the value NSC is getting per-shot by gamestate:
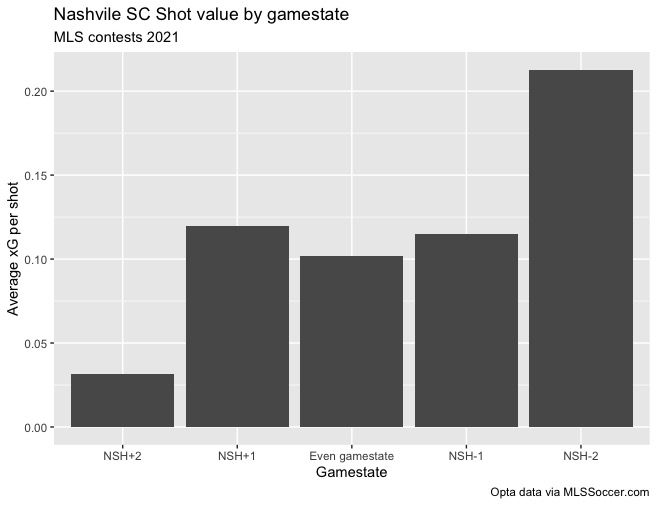
Nashville is not holding for good shots when leading by a pair (also: only two shots have happened when leading by a pair – small sample size there). Notably, the Boys in Gold are getting awesome shots when trailing by two. Some of that is the Opta formula overvaluing shots that end in a goal with that “big chance” flag – and Nashville has scored twice on seven shots when down a pair.
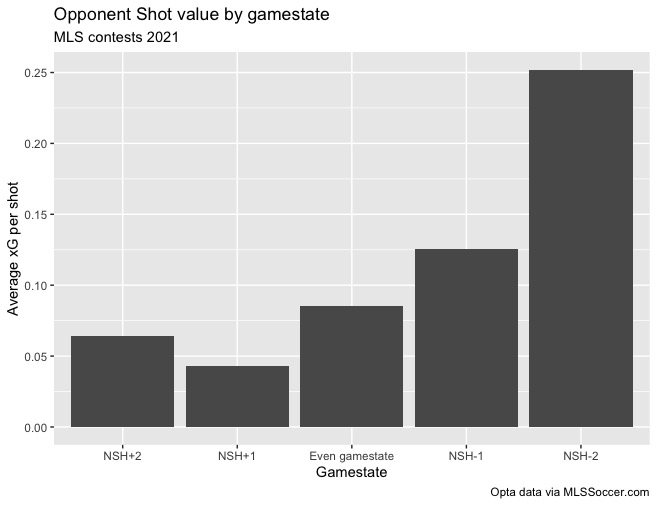
Opponents’ version of the same chart looks more like what you’d expect (and some of this speaks to the excellent quality of Nashville’s defense, as well): firing away when trailing, and being more selective the better a handle they feel they have on the game:
I got into this section (which ended much longer than I expected for obvious reasons!) largely trying to see if gamestate effects were a significant proportion of the team’s success in xG terms this year – and if that xG advantage would diminish as the wild swings of the early season faded. What we learned is that the effect is smaller than you might have expected, and if NSC was finishing at expected rates, this team’s record would be incredible, because they have the xG advantage regardless of whether they’re leading or trailing. (I think there’s also a smaller lesson about shot selection by gamestate, as well, when they want to salt the contest away, but that’s small sample size-driven).
* for simplicity, I’ve used the Opta xG data provided by MLSSoccer.com, rather than American Soccer Analysis, whose xG methodology I prefer. There are going to be some slight differences, but we have a good enough proxy.
Spinning it back to the micro
This game, on the other hand, felt like one in which NSC didn’t get a ton done until the sense of urgency was ramped to 11. The xG raceplot actually stays a bit closer than I’d have expected:
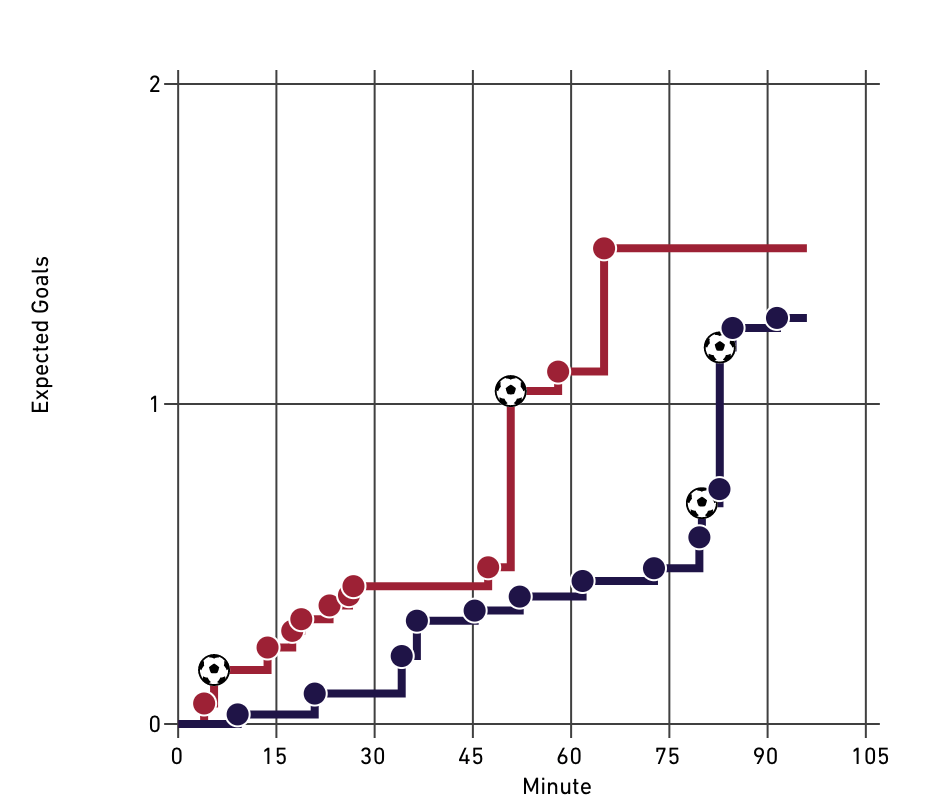
Atlanta barraged Nashville early (even though the goal wasn’t a high-value opportunity), and then NSC climbed back until the second Atlanta goal… at which point NSC climbed back once again.
Atlanta was the aggressor almost throughout, but I think there are gamestate lesson for the Five Stripes to learn here, as well: a possession-heavy team didn’t seem to have a sense of how to put the game away in the first half, and then lost its grip entirely in the second.
Miles to go before I sleep
Gary Smith specifically noted after the game that Miles Robinson’s distribution gave his club trouble. So let’s take a look at the US International’s passmap from the game. A particular type of pass is clearly going to jump out at you:

Atlanta really focused on getting him as deep into the attack as possible (having a hybrid formation with CDM Santiago Sosa playing as the middle portion of a back-three when the team was in possession helps facilitate that), and then banging a diagonal ball to a member of the attacking corps. That led to his assist on the opener, and gave Atlanta the ball in dangerous areas with space on a number of occasions.
Of course, it’s not just about the concept of hitting a long diagonal: he has to be accurate enough to actually connect those passes, as well. Robinson is, and it did indeed trouble NSC. The rest of his passing was almost exclusively recycling possession either with other members of the CB trio (including Sosa) or trying to stick reasonably conservative by sliding it to Brooks Lennon at RWB.

I actually really like the tactical setup Atlanta has available thanks to good personnel and the implementation of that personnel. Robinson may very well be the most important piece of that, at least in this one-game sample size (obviously creative wingers and one of the best finishers in league history play a major role, as well). They could probably do with a little better midfield spacing in the center of the pitch – given that Sosa’s in the backline in possession – however. As good as Sosa is, you’re asking a ton of him here in being the only non-striker player who doesn’t hang out wide.
Counterstrike?
Given that Nashville had only 38.3% of possession in this game, but managed to create nearly as many expected goals as the heavy-possession Atlanta, I was very much expecting NSC’s passmaps to be heavy on the vertical balls, with a bunker-counter mentality as the Boys in Gold sat back and let Atlanta open space in behind after turnovers.

Surprisingly I didn’t see that: the primary exception was Joe Willis, at left. He usually plays out of the back around 50% of the time with possession-maintaining passes, rather than long aerial-duel-creating boots. Against Atlanta, he was almost exclusively tasked with getting the ball into the middle third – or even attacking third – of the field. Trusting him to distribute longballs accurately (he completed 7/12 longballs and 3/3 shorter passes), or put it into an area where his team could win duels was his task. And win those duels, Nashville did: 9/15 for Hany Mukhtar, 5/10 for Jhonder Cádiz, 6/9 for Dax McCarty, 7/9 for Randall Leal… when you have a bunch of dudes winning those battles, and those battles are on the opponent’s half of midfield, you’re feeling pretty good about the value of your possession, even if the quantity of it is very low.
This is a club that has a reputation (likely undeserved) for being a “boot it long” squad. However, Nashville is only 15th in vertical distance per completed pass, according to ASA. Willis hit his passes at a longer clip than he has in any other game this year (not because he hit more long passes, but fewer short ones), while Dave Romney (15.43 vertical yards per completion), Dan Lovitz (14.29), and Walker Zimmerman (13.18) were above their season averages (9.07, 8.58 and 10.97, respectively).
Even if it didn’t look counter-oriented in the pass map, Nashville prioritized getting the ball forward and winning battles for it.
What did you see? Poke around the data a bit and let me know what piques your interest.

