

Welcome to The Graphical, wherein I mine the stats for some insight into how the most recent Nashville SC result came about. Today, NSC sticks to the 4-4-2 but can’t find a goal in Salt Lake City.
Similar performance, different results
There’s really not a whole lot of difference in the offense generated over the past two games:
| Game | Expected Goals for | Expected Goals against |
| A | 0.95 | 0.54 |
| B | 1.35 | 1.16 |
Nashville had a 0.41 xG margin in one of those games, and a 0.19 margin in the other… and won Game B by two goals while being unable to find a winner (despite the greater margin) in the most recent outing.
So what does that mean?
The most important point here is about the low-trials nature of the game, and the inherent randomness it creates between individual contests. A 40% three-point shooter on a basketball team is going to get 10 of those shots up a night, and more often than not hit 3-5 of them. A soccer team shooting a 12 shots with an average xG of 7.9% apiece may score twice. That team may very well go scoreless for multiple outings in a row. There’s little difference in the performance, even if the results are different.
Against New England, Nashville nicked a goal on a set piece, and then thanks to that lead was able to press to earn another one. Against RSL, the moment never came. The scoreboard – the only part that matters to the table – will say the team was two goals worse in Salt Lake than they’d been in Nissan Stadium a week earlier. But the results really weren’t that different. Taking into account homefield advantage (or away disadvantage, as it were), Saturday night saw a Nashville team that was probably better than the one that had just beaten New England.
I’m a bit of a skeptic that either performance indicates that the 4-4-2 is a worthwhile experiment on offense (other than for situational use), but clearly, the defensive performances have both been elite, so that’s something to keep in mind.
Penetrating to score?
Here’s Nashville’s passmap, with a couple caveats: starters only (to avoid being skewed by the switch to a 4-2-3-1-inspired formation toward the end), and open-play only (so no set pieces). It shows a team that actually did manage to get into some dangerous areas:
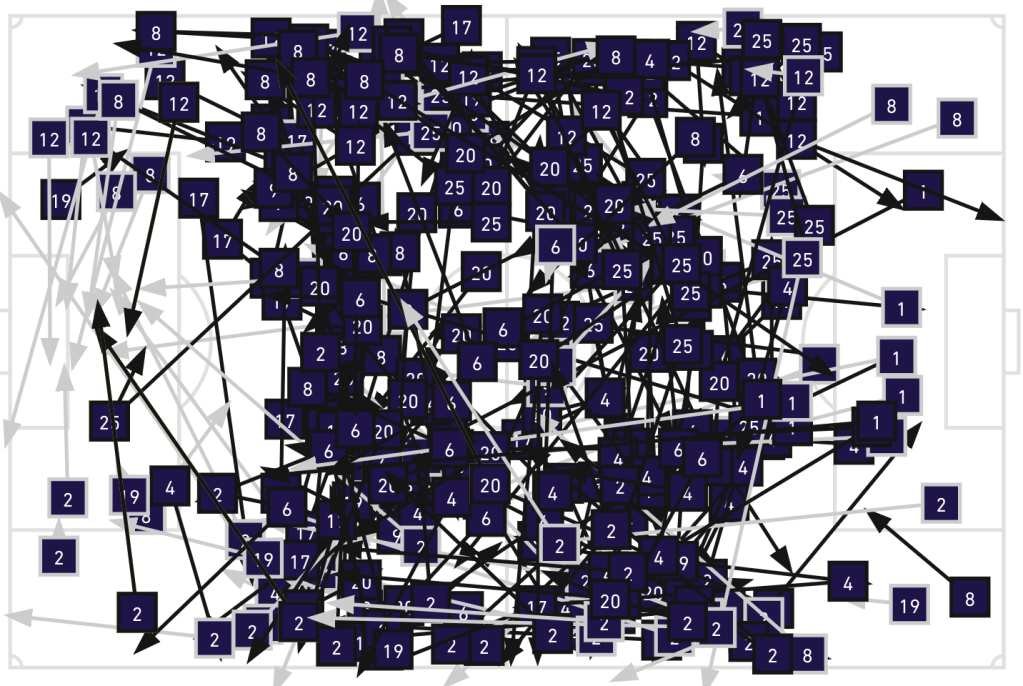
While the Boys in Gold couldn’t quite get right to the top of the penalty area, there’s some decent penetration into zone 14. There are also a bunch of passes into the box in dangerous areas.
The problem? Too much of that effort to get the ball into scoring areas came via the cross. That’s a low-value way to generate offensive chances. It’s sort of an inevitability of trying to play from a two-striker formation when things aren’t running as smoothly (and with a lead) as Nashville had seen the previous week.
Pack it in?
I’m having a hard time quantifying how Nashville’s gameplan changed in the final 20-plus minutes once the team seemed to run out of gas – and chose to hold on for a draw. However, I can say that the final 17 minutes saw probably the three most-dangerous of Real Salt Lake’s 12 shots all evening:
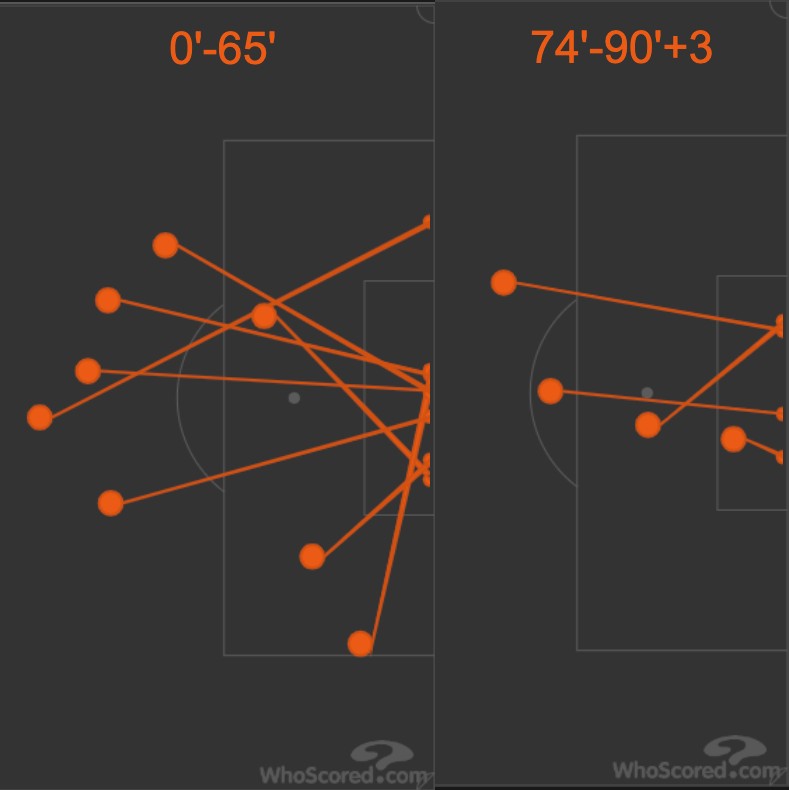
We all know by now that none of them managed to test Joe Willis, and that the most dangerous-looking of the bunch – the one right on the doorstep – also looked the most dangerous to the eyeball test.
It’s worth noting, though, that there’s a wide range of opinions into how valuable that shot was. You’ll recall it was a header from a cross. American Soccer Analysis gives it just 0.09 expected goals (StatsBomb via FBRef is in that range, as well), while Opta – the official data provider of MLS – called it 0.41 xG. I can’t speak to the specifics of the difference, though I would guess Opta gave Holt’s header a “big chance” tag because it looked dangerous, whereas the data providers/xG tabulators that don’t use the subjective “big chance” metric realized that a corner off a header is not nearly as dangerous as it looked – because more often than not, well, a header like that is going to be well off-target, as Holt’s turned out to be.
The other attempt from inside the box, which also came in that latter (much smaller) segment was the weird Damir Kreilach interception-turned-spinning-shot that probably should have been more dangerous, as well.
Either way, RSL’s attempts in the final portion of the game certainly look more dangerous on the shotmap, which can be a function of defending a little deeper and simply trying to escape with a point.
The Haakening
As I often like to do when a player gets his first significant playing time in a Gold (or Vibe II, whatever) jersey, let’s take a look at Luke Haakenson’s day:
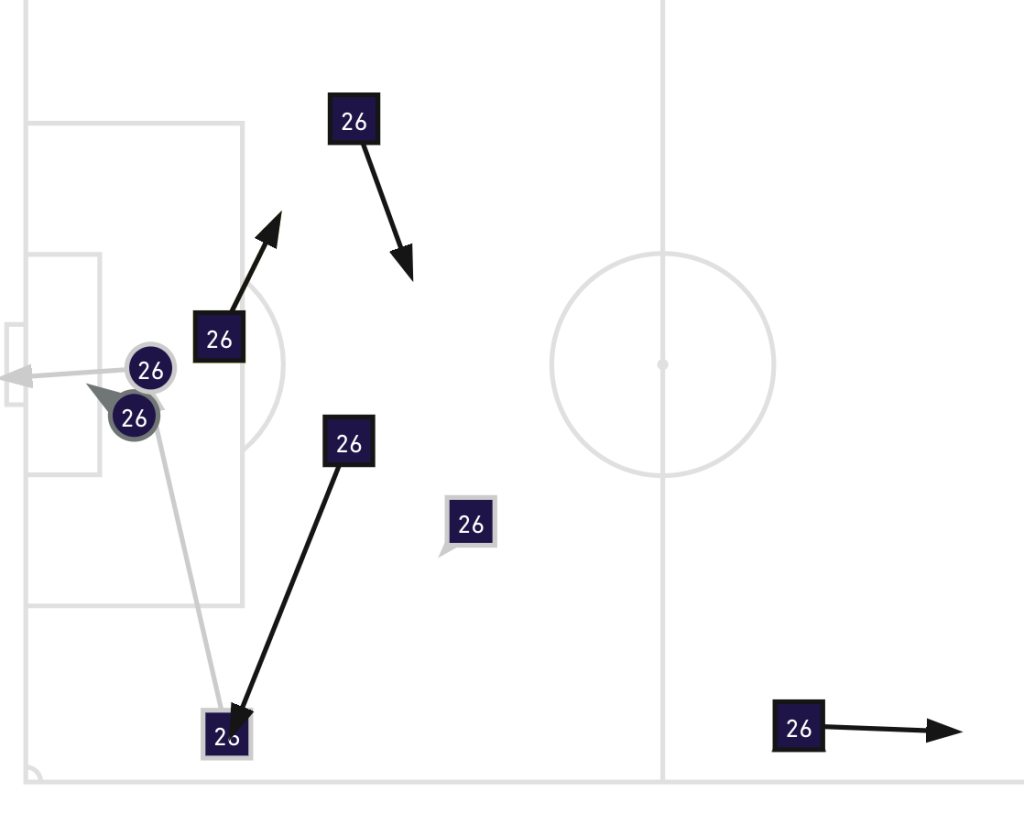
Given that he got nearly a half-hour of playing time (came on in 66′ and the game had three minutes of stoppage), there’s not a lot to see there! 5/7 passing is whatever, particularly given that one of the unsuccessful passes was a cross. One defensive action – unfortunately covered up by that backpass along the left touchline – in that time is a weird thing to see from a guy replacing Alex Muyl (one tackle lost, one clearance, seven ball recoveries in 67 minutes). By assisting Randall Leal’s miss and taking two shots, he did manage to lead the team in xG+xA.
Not much data to go on here, but his growth trajectory is impressive, given that he played real, meaningful minutes in a competitive, meaningful game on the road after spending all last season in USL. Hopefully next runout will give us a better chance to (statistically and pass-map-ily) draw some conclusions.

