
A new system in addition to the previous one! Semi-wacky results! There’s plenty of shakeup across the USL. Don’t forget to follow the site on Twitter, Instagram, and Facebook for all the content on USL, US Soccer, and Nashville SC.
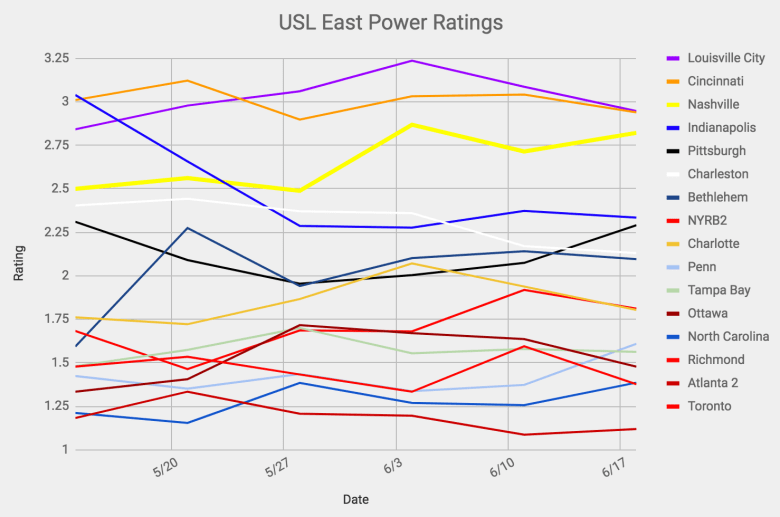
USL East Power Rankings:
- Louisville City 2.95
- Cincinnati 2.94
- Nashville 2.82
- Indianapolis 2.33
- Pittsburgh 2.29 (+2)
- Charleston 2.13 (-1)
- Bethlehem 2.10 (-1)
- NYRB2 1.81 (+1)
- Charlotte 1.80
- Penn 1.61 (+3)
- Tampa Bay 1.56 (+1)
- Ottawa 1.48 (-2)
- North Carolina 1.39 (+1)
- Richmond 1.38 (-1)
- Atlanta 2 1.12
- Toronto 0.18
So I gave in and finally just took Toronto off the bottom of the visual representation: second-to-last Atlanta United 2 is closer to playoff positions than they are to TFCII. Unless and until they win a game, they don’t get to be on the graph. Deal with it folks, I’m makin’ harsh decisions out here.
The big climber of the week is Pittsburgh, who continued its rebound from a rough stretch of form just a few weeks ago (three straight draws and a loss, now on two wins in a row). Their in-state compatriot Penn made a big leap, as well: a win and a draw, the former against a bad Richmond team, yes, but the latter against the best side in the East, Louisville City.
In the big picture, we’re continuing to see a stratification between several tiers: the top three remains, and the next four has gained a bit of separation on the teams below (that group has fluctuated in terms of the number of teams in it at times, but it’s looking as tightly-banded – and separated from others – as ever).
Red Bulls II and Charlotte Independence have a lead on the pack for what appears to be the final playoff position, but as you can see from Penn’s major rise in a single week, that’s hardly set in stone. Given that Charlotte actually stands fifth on the table, I’ll give them the nod over the back half-plus of the season (though the purpose of this exercise is, to a large extent, to point out that they’ll probably drop off in a major way when the schedule gets tougher).
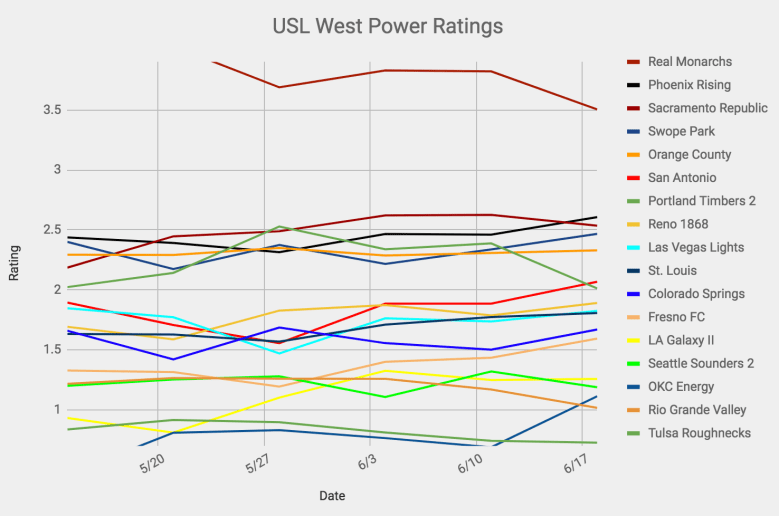
USL West Power Rankings:
- Real Monarchs 3.50
- Phoenix Rising 2.61 (+1)
- Sacramento Republic 2.54 (-1)
- Swope Park 2.47 (+1)
- Orange County 2.33 (+1)
- San Antonio 2.07 (+1)
- Portland Timbers 2 2.01 (-3)
- Reno 1868 1.89
- Las Vegas Lights 1.83 (+1)
- St. Louis 1.81 (-1)
- Colorado Springs 1.67
- Fresno FC 1.59
- LA Galaxy II 1.26 (+1)
- Seattle Sounders 2 1.19 (-1)
- OKC Energy 1.11 (+2)
- Rio Grande Valley 1.02 (-1)
- Tulsa Roughnecks 0.73 (-1)
Unlike the FAILING Toronto FC II, Real Monarchs did me a favor and moved toward the pack this week (I guess failing in more ways than one for TFCII). Their road loss to Swope was hardly damning – we’ll see in a moment that it’s actually an above-average result there – but given that scoring margin and home/road split aren’t included in this system, it’s still a big hit, with a bigger move than all but one team (in either direction).
That other move? A pair of wins for OKC (and the opposition including one previously pretty good team) vaults them from a reasonably-comfortable last place into third-bottom. They should enjoy it while it lasts: unless they continue a strong run of form, they shouldn’t be expected to win any of the next several times out.
Timbers 2 suffered a massive slide thanks to that loss to OKC, which they followed up by getting smacked by Colorado Springs. They’re the only other team that moved more than one spot in the table.
New ranking system
Whereas the existing ranking system took into account result, regardless of score (except inasmuch as it means win/loss/tie), this new system is the opposite: it takes into account goals, regardless of what the outcome is in the standings. It’s possible to have a “good loss” here. This system also takes into account home/road split.
It’s designed to be a bit more predictive (from an individual game standpoint) than descriptive (how deserving a team is of its place on the table given past results) in comparison to the previous one. It’s possible to have a “good loss” – Real Salt Lake’s 3-2 setback on the road against Swope Park is a good result compared to the typical road team, for example.

The methodology for these rankings is obviously quite different: it compares goals scored in a given game to the average given up by that opponent in that location, and vice versa for goals conceded. (For those with a base level of stats knowledge, the goals are standardized to the mean – relatively simple stuff). Offense-minus-defense for each location is the grade, and I’ve simply added the averages of individual game scores home and road for the power rating.
Nashville is a semi-surprising No. 1 in the table. They have a decent offense both home and road (about 0.25 standard deviations better than average), while boasting an elite defense at home – unsurprising, given they’ve only conceded one goal – and a very good one on the road. Real Monarchs have a better offense (about .4 standard deviations better than average) in both locations, while their home defense is very good and their road defense is fine. These are the two best home teams but the fourth- and fifth-best sides in the league on the road.
FC Cincinnati is by far the best road team in the league, but surprisingly, before this weekend’s romp over Richmond Kickers (which probably isn’t the most meaningful result they’ve had all year, but we’re comparing it to other Kickers road games, as well) were comfortably below-average at home. Drawing Pittsburgh and a4-1 win over NCFC had been their only above-average showings in Nippert – where they’d also lost twice to Louisville City and drawn Bethlehem Steel. It’ll be interesting to see if their overall form there improves…
I probably should have included offensive and defensive components in the graphic (will do for future weeks), but Cincy also has comfortably the best overall offense in the league, with OKC Energy comfortably the worst. It will surprise you to learn that TFCII actually has an above-average road offense, but that’s primarily built on scoring four goals in a loss at Atlanta United 2, and two in a loss at Penn FC.
Nashville’s defense is about half-again better than the second-best in USL (Orange County), while Toronto’s is almost twice as bad(!!!) as the second-worst (Atlanta). The Five Stripes Jr. are 32nd, but closer to No. 22 of 33 than they are to No. 33.
What it means for Nashville SC
With a stretch of home games now under way, Nashville (which has only been scored on once at First Tennessee Park) has a chance to rise up the table. Their position in the power ratings has been better than their spot on the table pretty much all year, and their rise up the latter has vindicated the validity of the original system (the new one is in its first week, though I had the numbers in before Saturday’s games, so you can see the impact the results make).
While I wouldn’t project that NSC finishes atop the table at season’s end (the weak start to the year hurts there), it seems a near-certainty that they host a playoff game, barring a radical change in form.

